Executive Summary
Investment Proposal
Under careful consideration, K Still Investments has
strong intentions to acquire the rights and ownership of the property listed
below. A brief listing of the property
details, market analysis, and financial analysis is outlined in the sections
below.
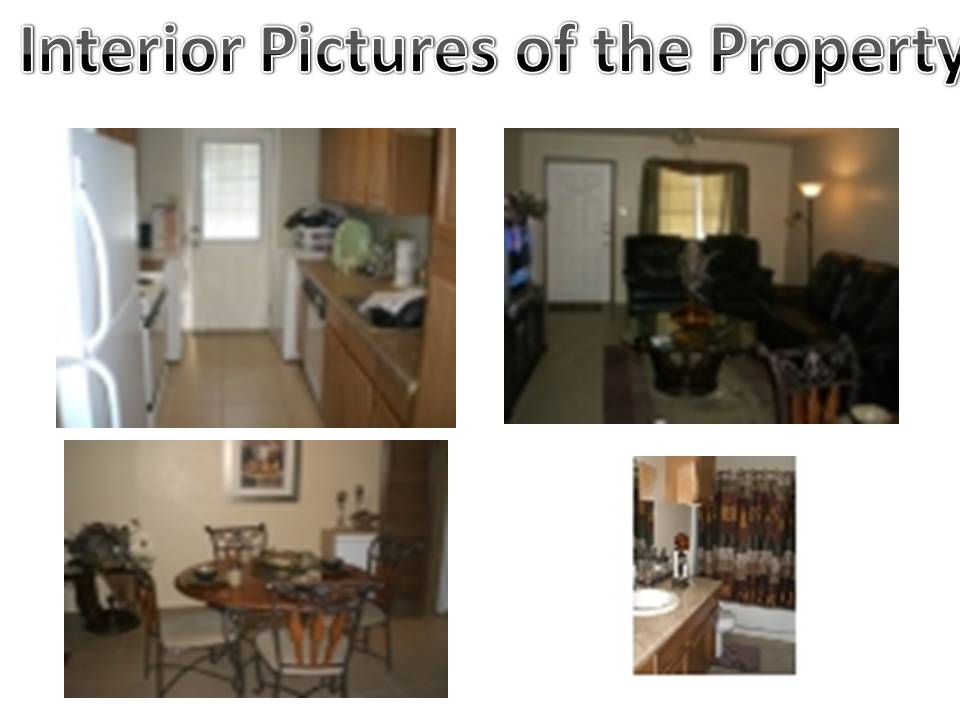
Property Description
The proposed investment is ownership of the Briarwood
Townhomes, a section of 4 multifamily housing units. The property is located at 7990, 7992, 7994,
and 7996 Gladys Street in the Beaumont, Texas.
Each address withholds 4 separate units and the entire property contains
16 units in all. All units have 2 bedrooms and 1 bath. The units were updated and remodeled in 2005.
The investment property is located in the west end of Beaumont, Texas, which
has undergone substantial growth in recent years. The occupancy rate for the
Briarwood Townhomes is 100%. The building size is 16,016 square feet. The price per unit is $78,125. The rent per unit is $750/ month. The purchase price asked by the seller of the
property was set at $1,250,000.
Market Analysis
Beaumont, Texas is the largest and most populated
city in Southeast Texas. The main cities
in the surrounding area are Nederland, Port Arthur, Orange, Port Neches, Vidor,
and Groves. The growing population in
Beaumont, Texas primarily consists of black, white, and Hispanic races. The target market for this property is
focusing on people in the low to middle income sector of the economy. The property is best suited for families in
this category looking for more cost effective housing. The Southeast Texas region is prospering with
it’s many opportunities for employment in the plant, construction, and industry
fields. This investment decision required comparing data from
similar multifamily housing in the west end of Beaumont, Texas. The data listed throughout the investment
proposal demonstrates that the purchase of the Briarwood Townhome property is
the most promising investment opportunity in the Southeast Texas region. The Westpark Townhomes located near the Briarwood Townhome property can be seen as a price comparable and competition in the area. The purchase price for the Westpark Townhomes is $550,000. The comparable property is much smaller than the investment property. The total square footage of the 6 Westpark Townhome units is 9,692. The best investment property would be the Briarwood Townhomes which would be more profitable in the long run.
Financial Analysis
The company has constructed a 10-year discounted cash
flow for the property to assess the internal rate of return and net present
value the investment will have at the end of the 10-year holding period. The assumed annual rental growth rate and annual
expense growth rates are 3% and 2%. The annual vacancy and collection loss is
2%. The company set the required rate of return (discount rate) for the
investment at 10%. The internal rate of
return (IRR) for the unleveraged cash flow and leveraged cash flow were 10.77%
and 25.14%. The data shows on the pro
forma most likely case that the investors’ required rate of return on the
investment would be reached at the end of the 10 years. The net present value (NPV) for the
unleveraged and leveraged cash flow shows that the property will continue to be
profitable and hold value through the 10-year holding period. The acquisition of the property by K Still
Investments will likely take place given the property is sold for 5% lower than
the original asking price. The
likelihood of this occurring is high considering the small number of investors in
the area.